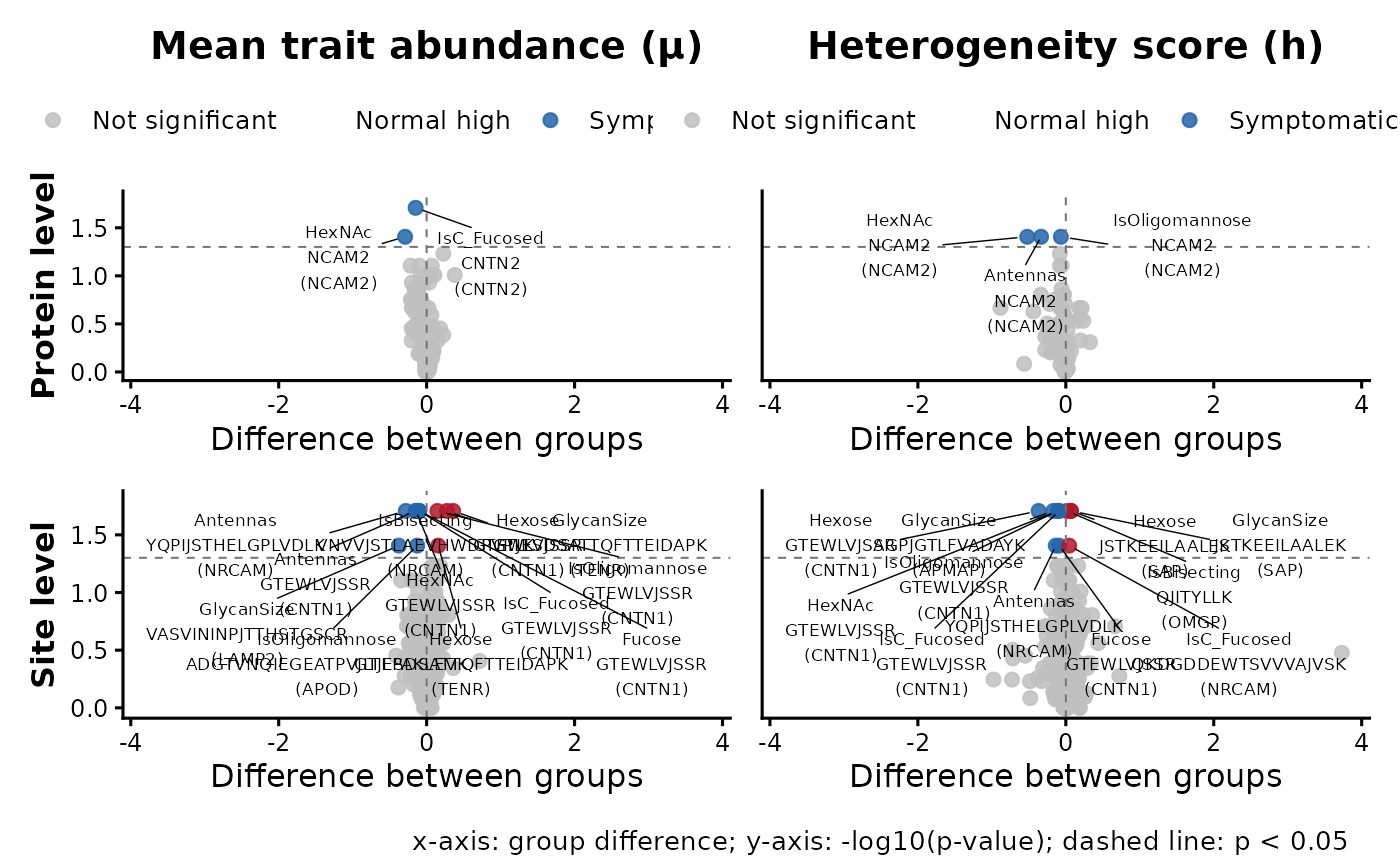
Visualize differential glycan trait abundance and heterogeneity results as volcano plots for protein- and site-level features.
plot_hscore_volcano(res, p_cutoff = 0.05, label_size = 2.3, max_labels = 15)Arguments
- res
A data frame returned by
analyze_hscore_changes- p_cutoff
Numeric p-value cutoff used to define significant points. Default is 0.05.
- label_size
Numeric text size for feature labels. Default is 2.3.
- max_labels
Maximum number of significant features to label in each panel. Features with the smallest p-values are labeled first. Default is 15.
Value
A ggplot2/patchwork object. The x-axis shows group
difference, the y-axis shows `-log10(p-value)`, and colors indicate
significance and direction of change.
Examples
res <- readRDS(system.file("extdata", "output_toyexample.rds", package = "glycoTraitR"))
#> Warning: cannot open compressed file '', probable reason 'No such file or directory'
#> Error in gzfile(file, "rb"): cannot open the connection
plot_hscore_volcano(res)