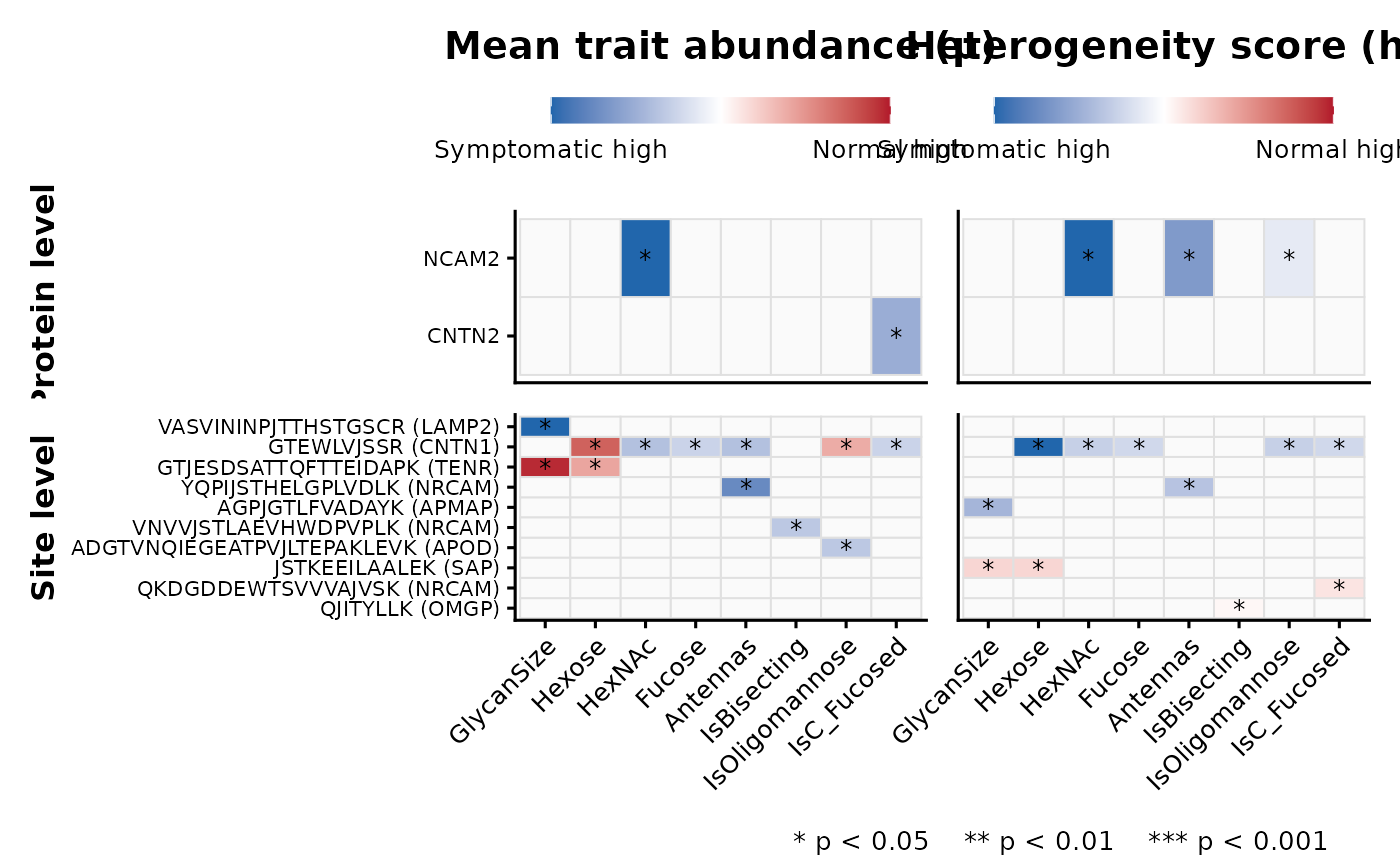
Plot significant glycan trait changes as a heatmap
Source:R/plot_glyco_traits.R
plot_hscore_heatmap.RdVisualize significant changes in glycan trait abundance and heterogeneity scores across protein- and site-level features.
plot_hscore_heatmap(res, p_cutoff = 0.05)Arguments
- res
A data frame returned by
analyze_hscore_changes.- p_cutoff
Numeric p-value cutoff used to select significant feature-trait pairs. Default is 0.05.
Value
A ggplot2/patchwork object showing significant
feature-trait changes. Tile color indicates the direction and magnitude of
`diff`, and stars indicate significance levels.
Details
The heatmap displays mean trait abundance (`mu`) and heterogeneity score (`h`) separately. Protein-level results are shown above site-level results when both are available. If either level is absent, only the available panels are shown.
Examples
res <- readRDS(system.file("extdata", "output_toyexample.rds", package = "glycoTraitR"))
#> Warning: cannot open compressed file '', probable reason 'No such file or directory'
#> Error in gzfile(file, "rb"): cannot open the connection
plot_hscore_heatmap(res)